





The Visual by Thai PBS

Present and reflect key points from massive data into easy-to-understand stories through the process of analyzing, designing, and telling data (Data Storytelling) to the audience in the form of various interactive multimedia under the brand “The Visual” with the concept of “Making Data Visible”.

เทียบปริมาณน้ำฝน ใน กทม.
DATA is All Around
เทียบปริมาณน้ำฝน
ใน กทม.

เมื่อย้อนดูสถิติปริมาณฝนตกสูงสุดรายวันของกรุงเทพฯ ตัวเลขสถิติได้สะท้อนความจริงที่น่ากังวลว่า… ความถี่ของฝนตกหนักในระดับ “เสี่ยงวิกฤตน้ำท่วม” ไม่เคยลดลงเลยแม้แต่น้อย

previous arrow
next arrow
ราคาน้ำมันแพงตรงไหน?
เทียบปริมาณน้ำฝน ใน กทม.
Slide 2
previous arrow
next arrow

The Visual Talk • DATA is All Around

สัมผัสประสบการณ์ใหม่ของการสื่อสารที่ผสมผสานระหว่าง DATA และ Visual เปลี่ยนข้อมูลที่ซับซ้อนให้มีชีวิต และเข้าใจง่าย ด้วยเทคนิคเฉพาะตัวจากผู้เชี่ยวชาญแต่ละด้าน กับงาน The Visual Talk : DATA is All Around

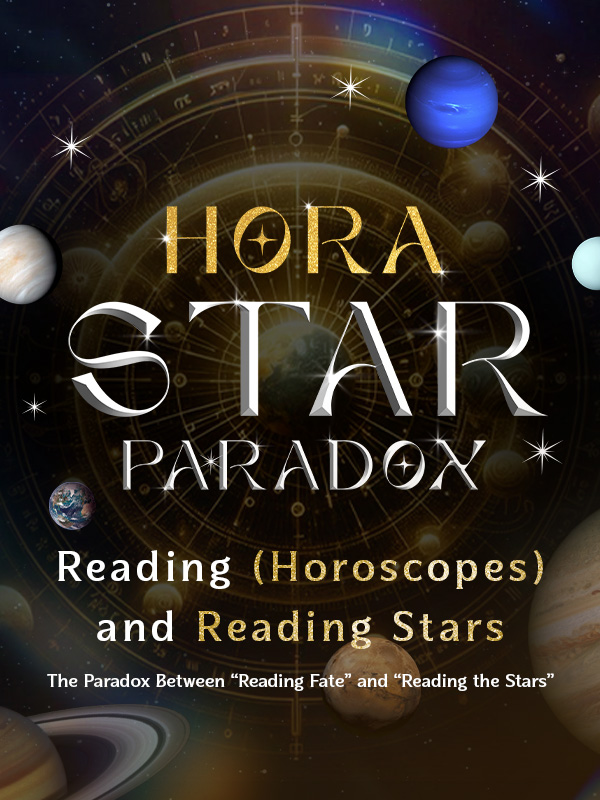
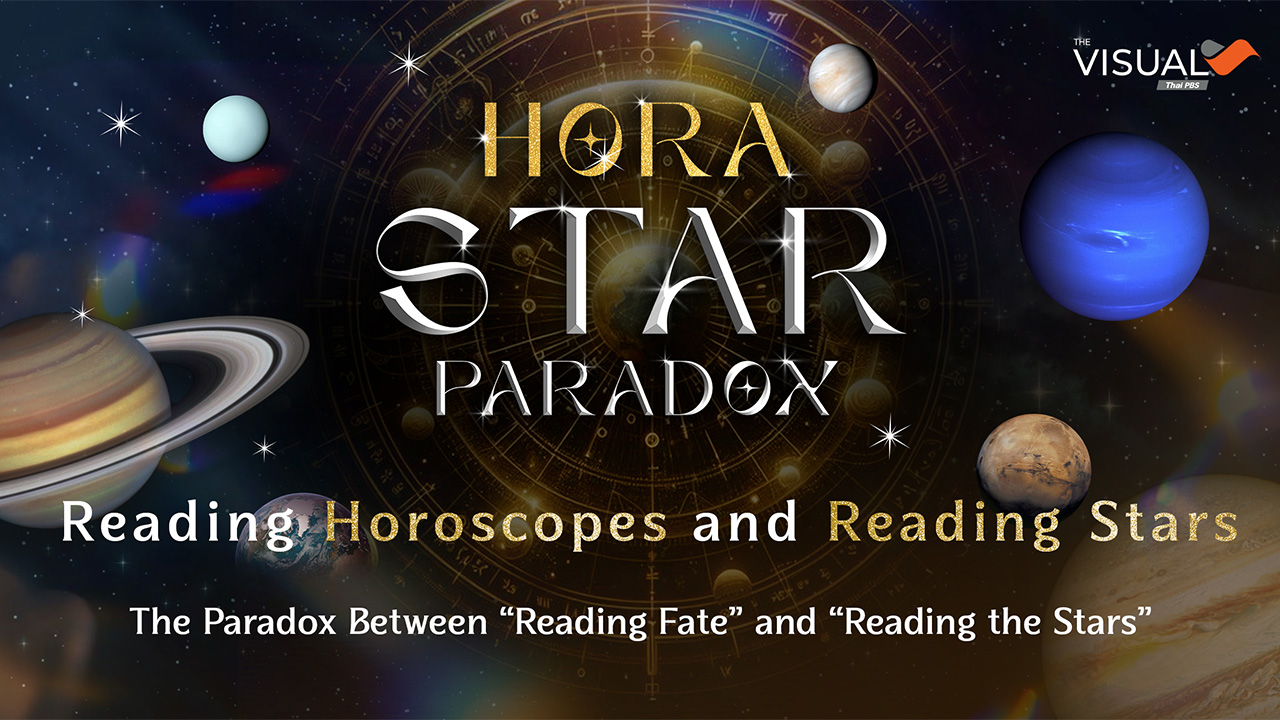
Hora • Star • Paradox Reading (Horoscopes) and Reading Stars

Hora • Star • Paradox
Reading (Horoscopes) and Reading Stars

It is said that… if the “stars” shift even slightly it does not change only the sky but also the destiny of humankind.

previous arrow
next arrow
Hora • Star • Paradox Reading (Horoscopes) and Reading Stars
The SCAMMER: โปรย “เศษเงิน” วางกับดัก ล่าเด็กไทย
ปอกเรื่องราวใต้เปลือก "ทุเรียนไทย" สู้ศึกชิงบัลลังก์ราชาหนาม

No posts found.